
What each part of your monthly report means
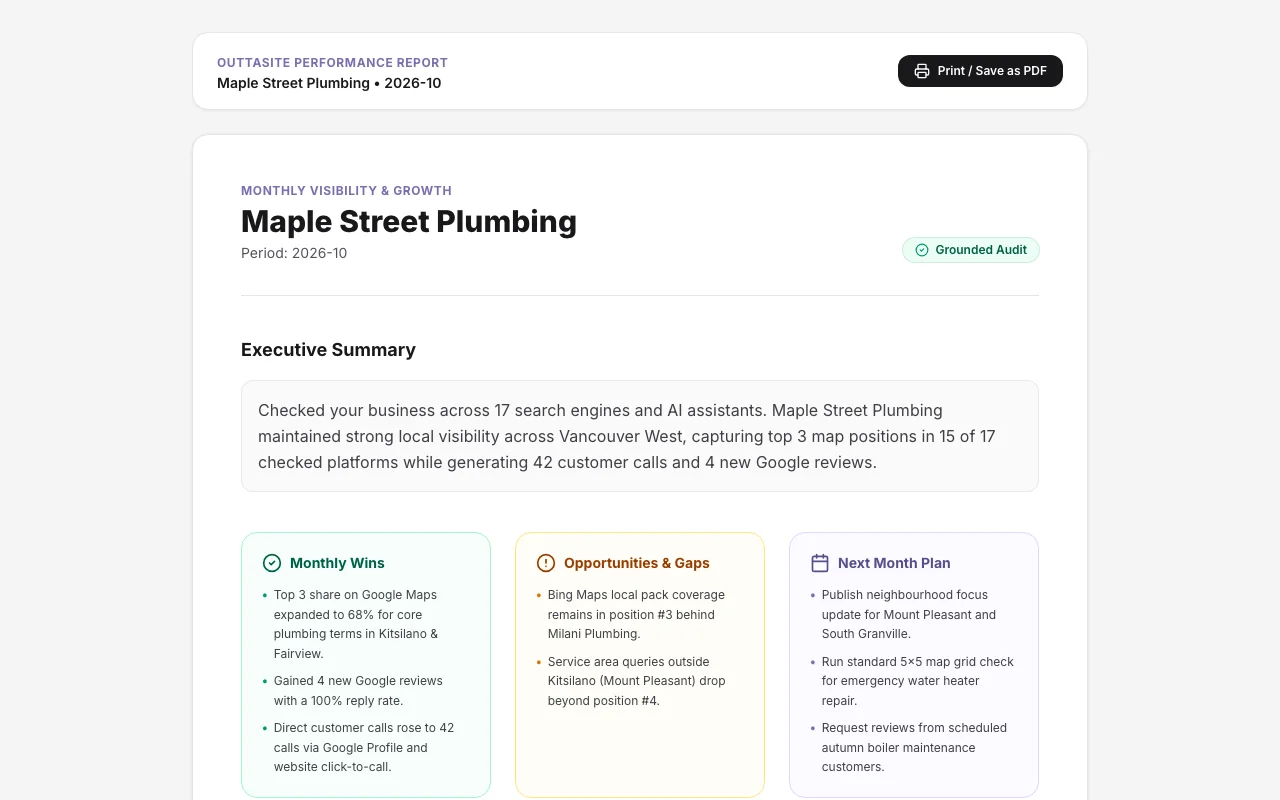
OuttaSite generates a comprehensive monthly report reviewing your search presence, customer interactions, and local map rankings across 17 platforms.
Map grid colours
Your report features a 5 by 5 local map grid covering your service area. Each circle represents a physical location in your city and displays your ranking when someone at that exact spot searches for your trade:
- Green circles (Rank 1, 2, or 3): Your business appears in the top 3 Google 3-pack map results. Customers see your phone number and reviews immediately without clicking "More places".
- Yellow circles (Rank 4 to 10): You appear on the first page of Google Maps results, but customers must scroll or click through to see your listing.
- Red circles (Rank 11+): Your business ranks lower on Google Maps in that neighbourhood.
- Gray circles (Unranked): Your listing was not found in the top 20 results for that location.
Customer actions
The customer actions section records direct actions taken by prospects from your Google profile:
- Phone calls: Customers who tapped your phone number directly on Google.
- Website clicks: Visitors who clicked from Google to visit your website.
- Direction requests: People who asked Google Maps for driving directions to your location.
Wins, problems and plan
Every report includes three key sections:
- Wins: Specific areas where your visibility improved or where customer calls increased.
- Problems: Places where competitors rank higher or where listings are incomplete.
- Plan: Three direct tasks Autopilot will carry out during the coming month to improve your ranking.
Still have questions?
Our Vancouver team is here to help with your profile or website anytime.